How to develop and evaluate proof of concepts for presenting big data insights effectively.
Techniques for identifying and understanding the needs of your target audience.
Methods to discern significant features and trends within big data for impactful presentations.
Best practices for using data visualisation tools to create engaging and interactive dashboards.
Strategies for aligning data presentations with business objectives and stakeholder expectations.
Approaches to maintaining data accuracy and reliability in your presentations.
How to utilise storytelling to guide stakeholders through data insights compellingly.
Techniques to ensure accessibility and usability in your big data presentations.
COURSE OVERVIEW
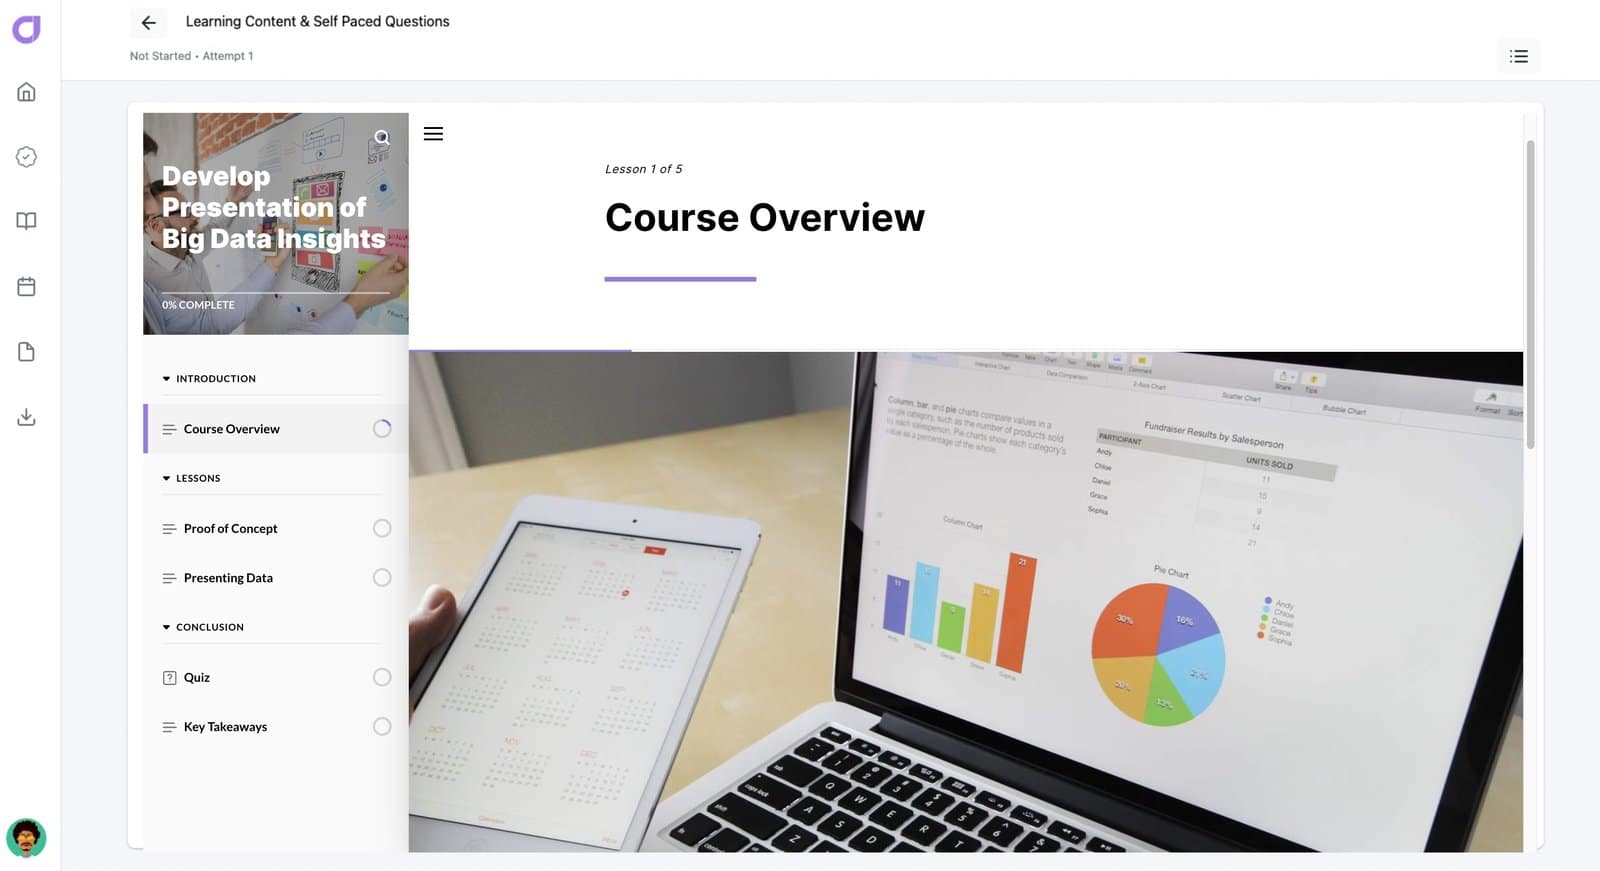
The “Presenting Big Data Insights” course is designed to equip professionals with the skills needed to transform vast amounts of data into compelling presentations that drive informed decision-making. Beginning with the fundamentals, you will learn how to develop proof of concepts that validate the feasibility and potential of your data presentations. This involves understanding the specific context of your presentations and tailoring them to meet the needs and preferences of your target audience, ensuring maximum impact.
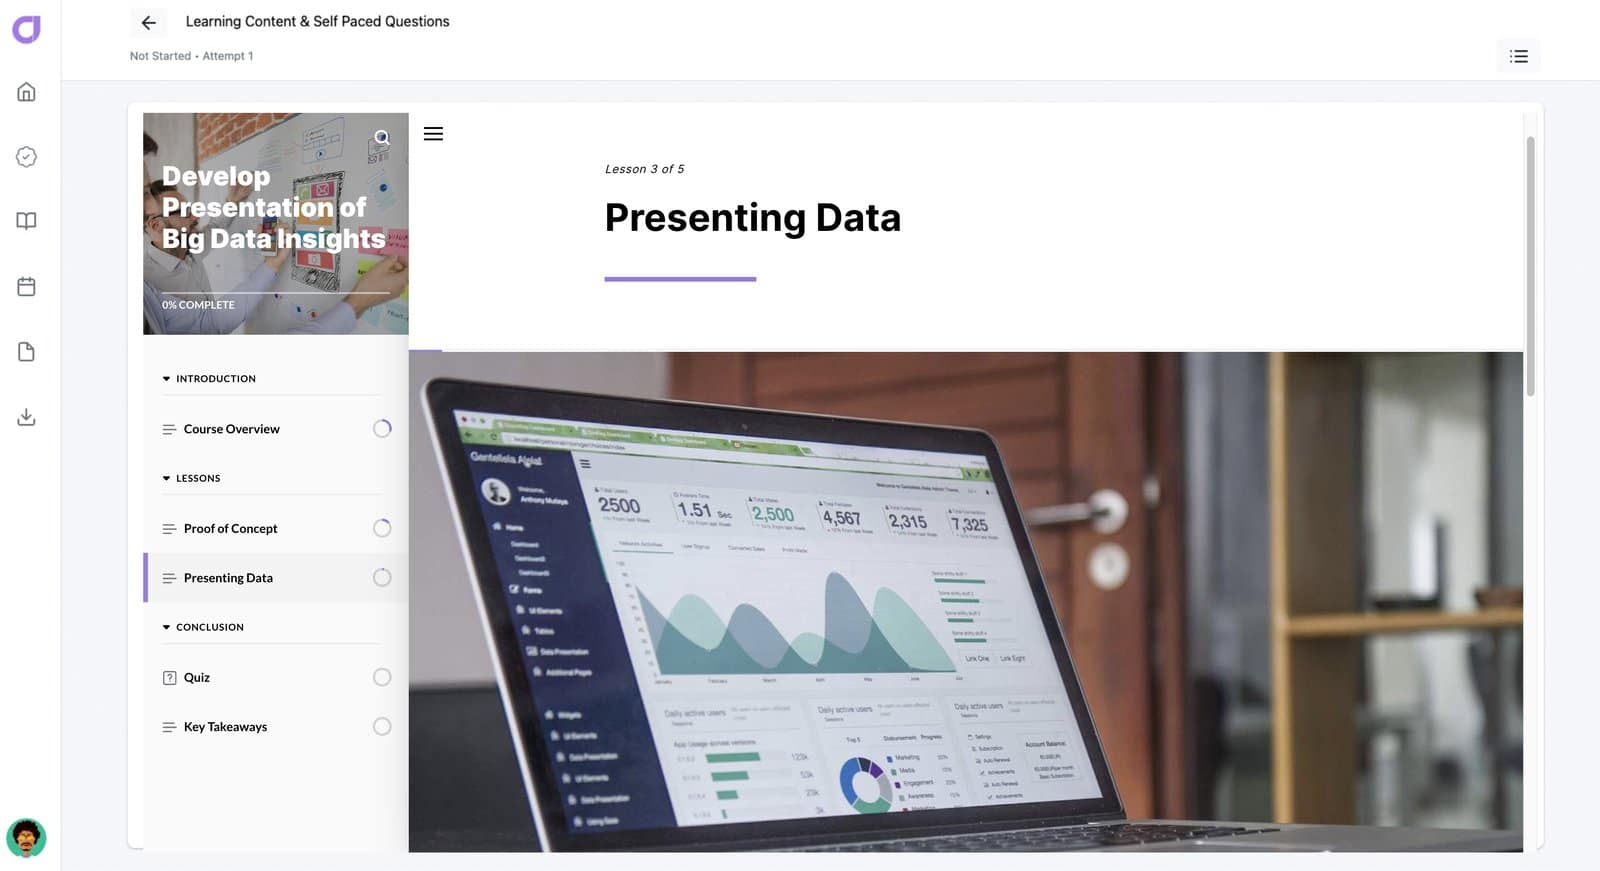
As you progress through the course, you will delve into advanced techniques for identifying and analysing relevant data, creating data models, and constructing interactive dashboards. These skills are crucial for visualising complex data clearly and engagingly. The course also emphasises the importance of storytelling in data presentation, helping you to frame your insights around a central theme that resonates with your audience. By the end of the course, you will be adept at using various data visualisation tools to create presentations that are not only informative but also visually compelling and accessible to all stakeholders.
COURSE PREVIEW
COURSE ACTIVITIES
Introduction
Course Overview
Lessons
Proof of Concept
Presenting Data
Conclusions
Quiz
Summary
1
ENROL
Enrol yourself or your team into our free course to upskill now
2
CERTIFICATE
Access your certificate which can be added to your LinkedIn profile.
3
EXPLORE
Explore our platform to improve your training and assessments outcomes!
Upon completion you will be issued with a course certificate which will be saved in your account and can be shared on Linkedin under your Licenses & Certifications.