Select the appropriate graph style to effectively communicate data insights.
Prepare and refine spreadsheet data for accurate and clear visualisation.
Construct various types of graphs, such as bar charts, line charts, and pie charts.
Annotate graphs with precise labels and titles to enhance interpretability.
Organise and name spreadsheet files systematically for easy access and future use.
Ensure data integrity and save changes properly before exiting spreadsheet applications.
Utilise spreadsheet tools to customise and fine-tune graph aesthetics.
Implement best practices for data management and visual communication.
COURSE OVERVIEW
In the “Introduction to Creating Effective Graphs and Managing Spreadsheet Data” course, participants will embark on a comprehensive journey into the world of data visualisation. The course begins by emphasising the importance of selecting the right graph style to convey the underlying message within the data. Participants will learn to navigate various graph types, such as bar charts, line charts, and pie charts, understanding their unique strengths and applications. This foundational knowledge will be complemented by practical lessons on preparing and refining spreadsheet data, ensuring that it is optimally structured for graph creation.
As the course progresses, participants will delve into the art of constructing graphs, mastering the intricacies of labelling axes, adding titles, and customising graph elements for clarity and impact. The course also highlights the significance of organised data management, teaching participants how to systematically name and store spreadsheet files to enhance workflow efficiency. Additionally, the course covers best practices for exiting spreadsheet applications, ensuring that changes are saved and data integrity is maintained. By the end of the course, participants will be equipped with the skills to create visually compelling graphs and manage spreadsheet data effectively, enabling them to communicate data insights with precision and confidence.
COURSE PREVIEW
COURSE ACTIVITIES
Introduction
Introduction to the Course
Lessons
Determining the Appropriate Graph Style
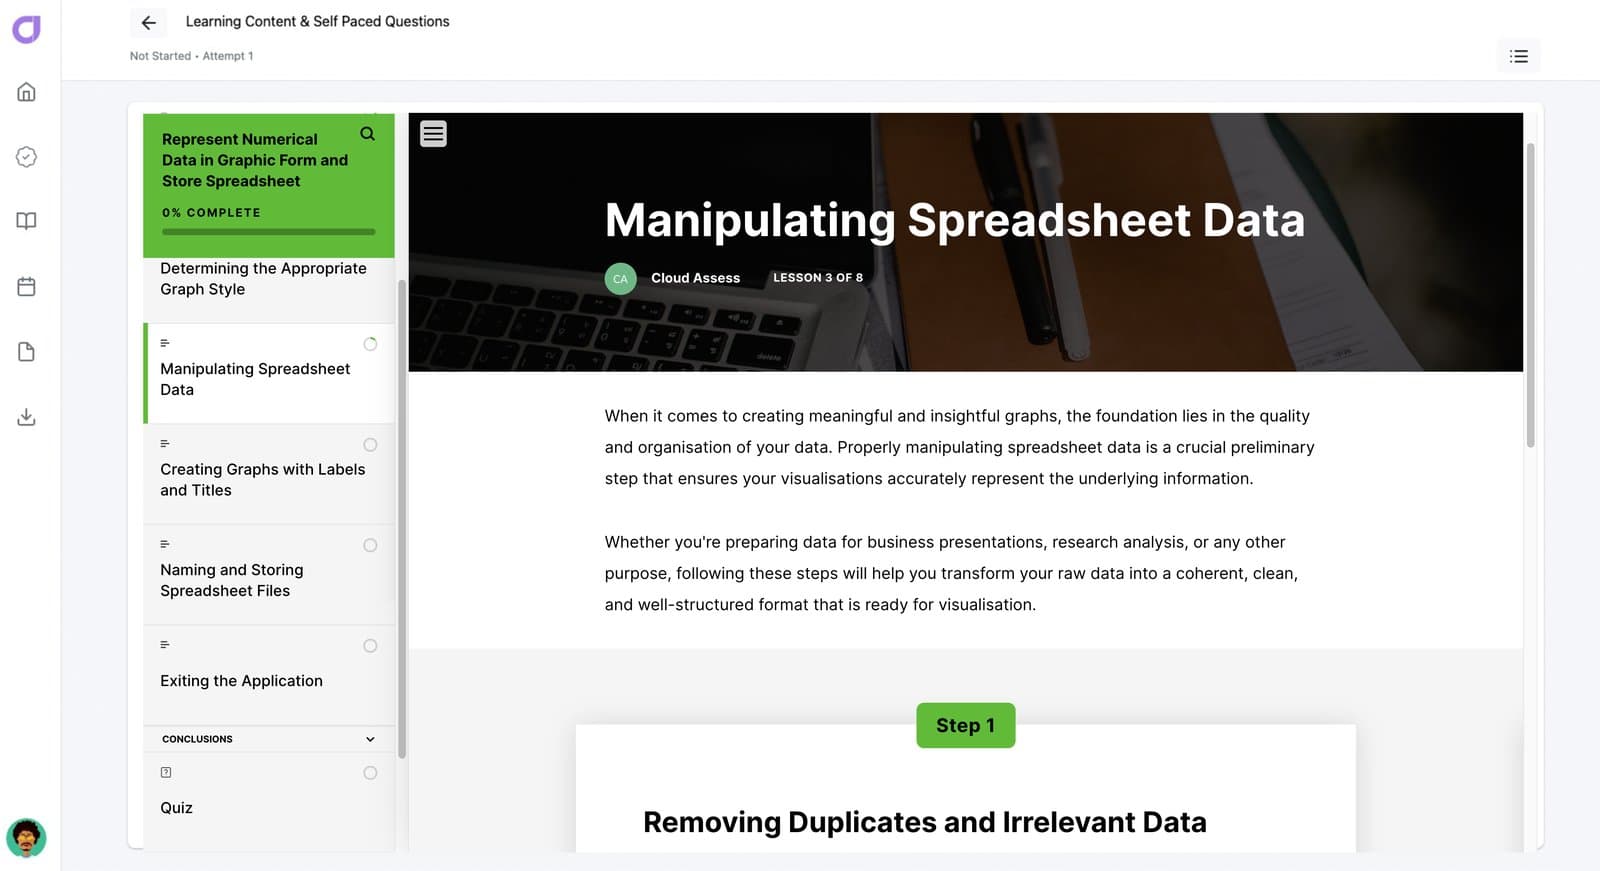
Manipulating Spreadsheet Data
Creating Graphs with Labels and Titles
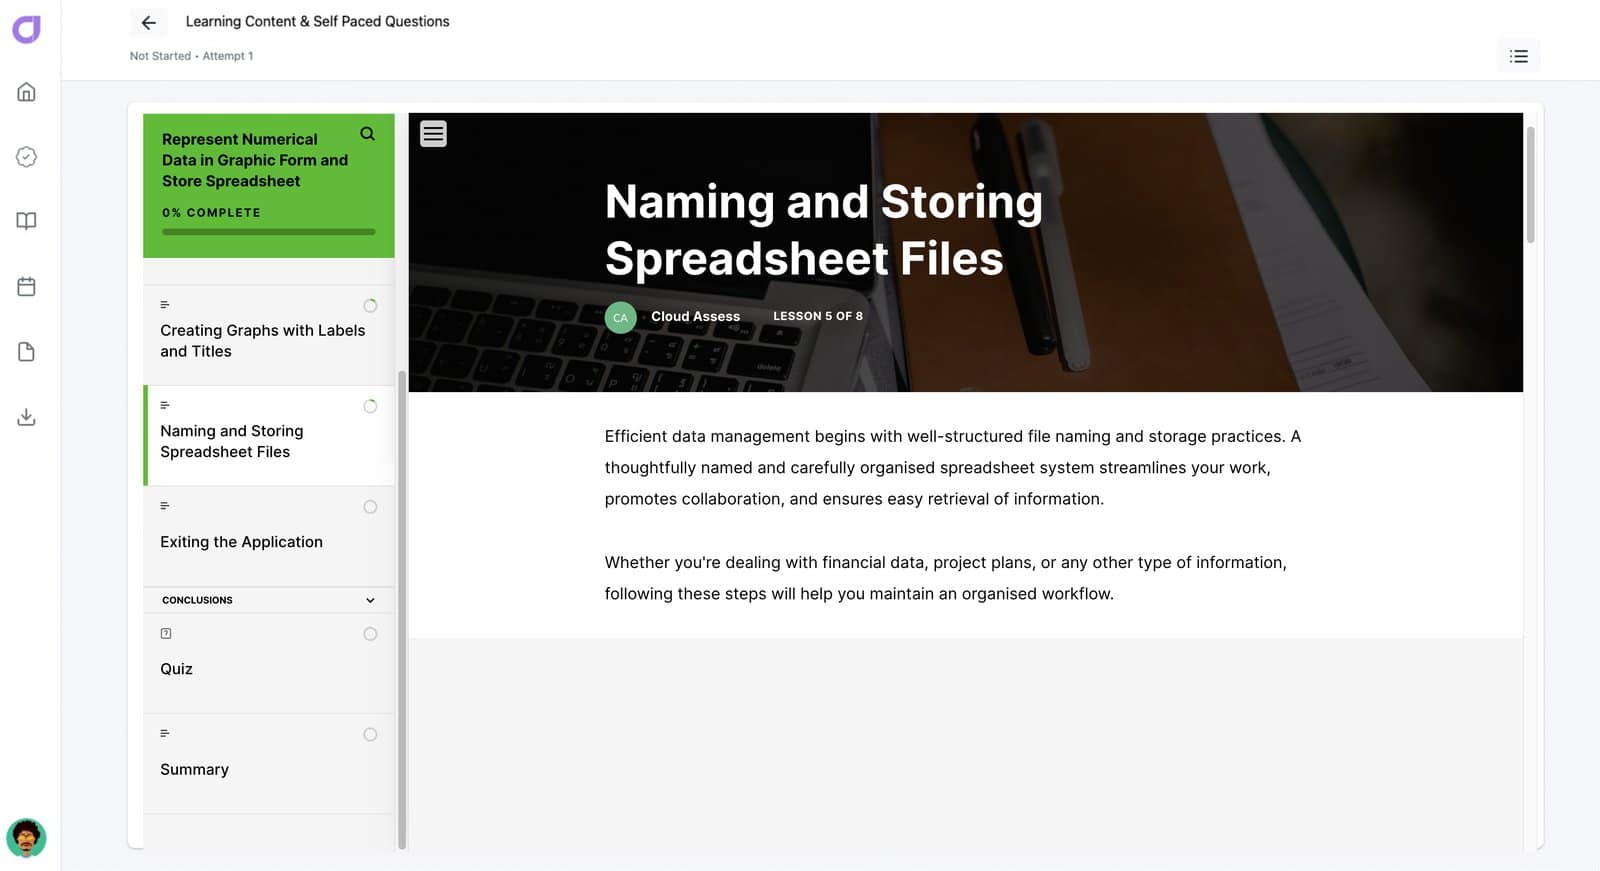
Naming and Storing Spreadsheet Files
Exiting the Application
Conclusions
Quiz
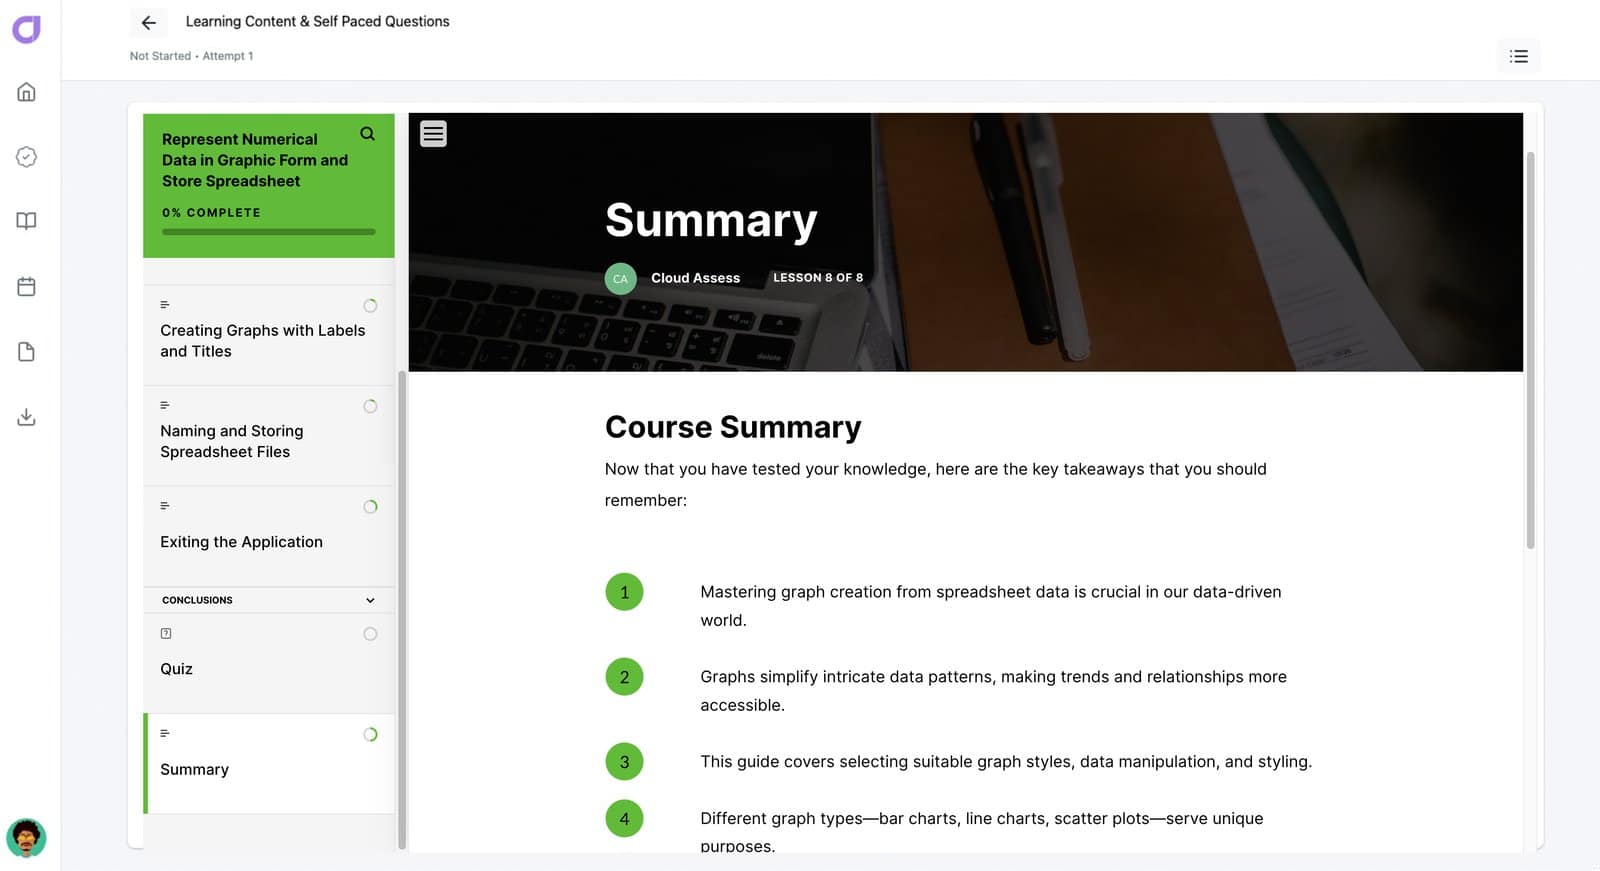
Summary
1
ENROL
Enrol yourself or your team into our free course to upskill now
2
CERTIFICATE
Access your certificate which can be added to your LinkedIn profile.
3
EXPLORE
Explore our platform to improve your training and assessments outcomes!
Upon completion you will be issued with a course certificate which will be saved in your account and can be shared on Linkedin under your Licenses & Certifications.